海洋中尺度涡(百公里尺度)基本遍布各大洋。把同一时刻所有涡的面积加起来,接近全球水域面积的三分之一。这当然是算出来的。怎么形象地理解这回事呢?我们不妨玩一把数据可视化,把中尺度涡都挪去大西洋,看看能不能塞满它。为什么选大西洋?因为Wikipedia记载它覆盖了全球水域面积的29%,正好适合以涡填海。
资料记载
在挪涡之前,先看看哪些论文记载了中尺度涡覆盖面积在水域面积中的占比。
当提到涡覆盖了近三分之一水域面积这一数据时,大家多引用的是Alexis Chaigneau关于四个主要东边界上升流区内的中尺度涡的文章1:
The four major eastern boundary upwelling systems: “The total area covered by CE and AE represents 25–30% of the considered oceanic region (Table 1).”
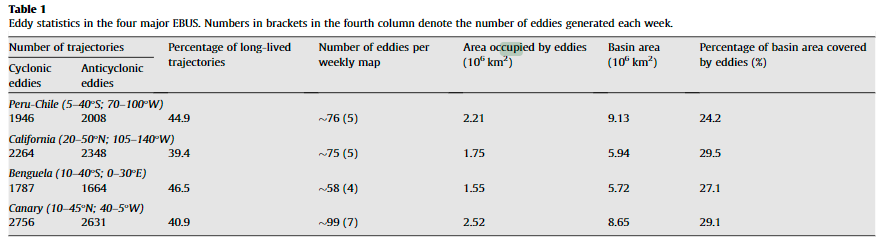 Table 1 Chaigneau, et al. (2009)1
Alexis还有一篇更早的08年的文章2,关注的是秘鲁沿岸的中尺度涡,也计算了涡在其研究海区的日常覆盖面积:
Mesoscale eddies off Peru: “The mesoscale structures cover an average total area of around 6.5105 km2, representing 25% of the study region.”
其它海域关于涡盖面积比例的文章就出现得比较晚。比如Haussman et al. (2017)3:
The Southern Ocean: “With a fraction of time and space of the SO covered by eddy cores of approximately 20%, this study suggests a small impact of eddies on deepening the climatological mean SO winter mixed layer. “
和Czeschel et al. (2018)4:
The eastern tropical South Pacific: “Both types of eddies have an average radius of about 70 km and on average 15 % of the ETSP are covered everyday with eddies (Fig. 1a)”
在我们南海,计算了涡覆盖比例的文献算是较多的。较早时,有修鹏研究员的文章5,统计水深1000m以上区域的南海中尺度涡平均覆盖了9.8%的南海面积。18年,有两篇文章重新提及了这个百分比。一篇是詹海刚研究员团队何庆友老师的文章6,从涡内Argo数量在总数量中等占比,推知南海涡覆盖面积占比大概在25%:
A total number of 970 and 924 Argo profiles are located within 1R of the compositecyclonic and anticyclonic eddies, respectively. They account for 27% and 23% of the total number of profiles that are associated with cyclonic and anticyclonic eddies, respectively. These proportions support that eddies occupy ∼25% of the oceanic surface in the SCS.
另一篇是董昌明教授团队的文章7,他们计算了涡覆盖占比的月变化(如下图):
Xiu et al. 5 suggested the mean area covered by eddies with depths greater than 1000 m was around 9.8% of the SCS area each year. Figure 3 illustrates the monthly variation of the percentage of eddy covered area occupying the whole size in the SCS. The mean area covered by eddies is 16.0–20.7% in the SCS, where the highest (lowest) percentage appears in March (January).
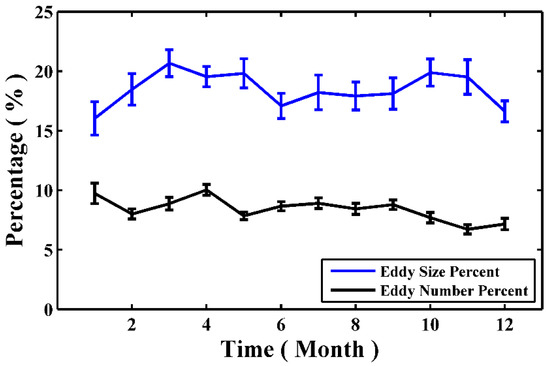 Figure 3 in Sun et al. (2018)7. Monthly variation of the percentage of the eddy surface size compared to the whole size of the South China Sea (blue line) and the percentage of eddy number occupying all the eddies (black line). The standard errors are also shown in the figure.
可能还有文献有相关记载,欢迎补充。
开始挪涡
所用数据
这套资料并未有中尺度涡边缘的位置数据,所以每个涡均以其等效半径所画的圆来表示。
挪涡方法
概括
随机生成一个大西洋里的经纬位置放被挪涡,找到能塞进这个位置的最大的涡,确保这个涡的圆形不与岸界,大西洋边界和其它涡圆形重叠。
具体步骤
- 先把大西洋的涡列个list,这些涡不需要挪。每挪一个涡进大西洋,就把这个涡的新位置依序放进这个list;
- 把要挪的不在大西洋的涡也建立一个list,这个list就是待挪涡的list。每挪走一个涡,这个list就短一点,直到list里所有涡都被挪走;
- 随机生成一个经纬度,作为可能的放涡的地方;诊断这个随机生成的经纬度是否在大西洋里;
- 如果在大西洋里,就计算该经纬度与大西洋边界、岸界和所有已在大西洋内的涡(包括本来就在的和此前挪进去的)的圆形边缘的距离;
- 上述距离的最小值代表了能塞进该位置的涡的最大半径。如果塞进一个半径大于该最小值的涡,则该涡可能与大西洋边界或岸界或已存在的涡发生重叠。
- 在待挪涡list里搜寻是否有涡可以满足半径小于上述距离最小值;
- 如果有,就把这个涡挪走;如果没有,就重新生成新经纬度,重复上述过程,直到所有涡都被挪进大西洋。
- 能否都挪完看人品。有可能会塞不下。
所需依赖
The M_Map toolbox 和它的 m_coasts.mat。
所用MATLAB版本
- R2015a
致谢
最终效果图
以1993年1月1日数据为例:

](https://upload.cc/i1/2019/07/07/QOzr6F.png)
效果还是挺赞的,大西洋被塞得满满当当。比直接拿数据去算涡覆盖占比要费事多了,但是实现动画的过程和结果都很有趣,成功把科研升华为科普。
代码开源
https://github.com/chouj/MoveEddiesIntoAtlantic
参考文献
- Alexis Chaigneau, Gérard Eldin, Boris Dewitte (2009), Eddy activity in the four major upwelling systems from satellite altimetry (1992–2007), Progress in Oceanography, Volume 83, Issues 1–4, Pages 117-123, ISSN 0079-6611,
https://doi.org/10.1016/j.pocean.2009.07.012. - Alexis Chaigneau, Arnaud Gizolme, Carmen Grados (2008), Mesoscale eddies off Peru in altimeter records: Identification algorithms and eddy spatio-temporal patterns, Progress in Oceanography, Volume 79, Issues 2–4, Pages 106-119,
ISSN 0079-6611, https://doi.org/10.1016/j.pocean.2008.10.013. - Hausmann, U., McGillicuddy, D. J., and Marshall, J. (2017), Observed mesoscale eddy signatures in Southern Ocean surface mixed‐layer depth, J. Geophys. Res. Oceans, 122, 617– 635
- Czeschel, R., Schütte, F., Weller, R. A., and Stramma, L. (2018): Transport, properties, and life cycles of mesoscale eddies in the eastern tropical South Pacific, Ocean Sci., 14, 731-750, https://doi.org/10.5194/os-14-731-2018.
- Xiu, P.; Chai, F.; Shi, L.; Xue, H.; Chao, Y (2010). A census of eddy activities in the South China Sea during 1993–2007. J. Geophys. Res., 115.
- He, Qingyou & Zhan, Haigang & Cai, Shuqun & He, Yinghui & Huang, Gaolong & Zhan, Weikang. (2018). A New Assessment of Mesoscale Eddies in the South China Sea: Surface Features, Three-Dimensional Structures, and Thermohaline Transports. Journal of Geophysical Research: Oceans. 10.1029/2018JC014054.
- Sun, W.; Dong, C.; Tan, W.; Liu, Y.; He, Y. ; Wang, J. (2018), Vertical Structure Anomalies of Oceanic Eddies and Eddy-Induced Transports in the South China Sea. Remote Sens. 10, 795.