因为“今日南海中尺度涡”是一个每日更新的项目,所以希望能在它自动更新后获得即时推送。觉得有两条路:要么直接在项目的执行脚本里加上一段,输出一个XML后缀的RSS Feed文件,这样直接用RSS阅读器订阅这个Feed就好了;要么想办法通过Webhook激活企业版微信机器人,实现在企业版微信群的推送。不过,第二条路的可行性未知。先搞定第一条路再说。
因为MATLAB自带xmlread、xmlwrite,所以这事儿简单。但还真就没在Google上搜出什么现成可套用的东西。那这个模板还是我来提供吧,代码如下。根据变量名就可以知道是干嘛的,所以注释就不写了。
%%%%%%%%%%%%% XML-version RSS file generation by using MATLAB %%%%%%%%%%%%%
% A Script Instance written by https://github.com/chouj
% The XML-version RSS file generated by this script can be found here:
% https://gitee.com/oceanography/South-China-Sea-Mesoscale-Eddies-Today/blob/master/rss.xml
%
% March 08 2020
%
% Tested by using MATLAB R2015a
%
% Potential error might be caused by how different version of MATLAB handles "datetime".
%
% Please refer to https://validator.w3.org/feed/docs/rss2.html about the required elements in a XML file for RSS Feed.
docNode = com.mathworks.xml.XMLUtils.createDocument('rss');
rss = docNode.getDocumentElement;
rss.setAttribute('version','2.0');
channel = docNode.createElement('channel');
feedtitle= docNode.createElement('title');
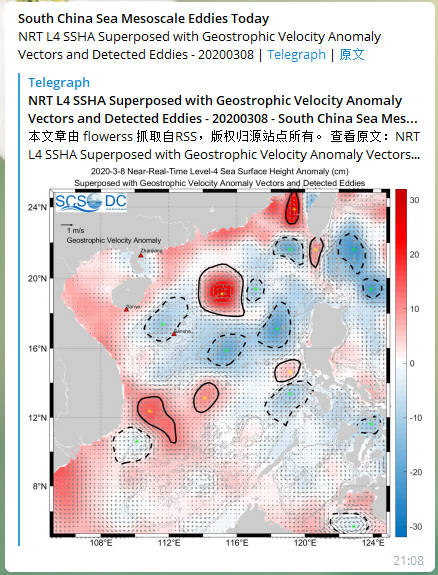
feedtitle.appendChild(docNode.createTextNode('South China Sea Mesoscale Eddies Today'));
channel.appendChild(feedtitle);
feedlink = docNode.createElement('link');
feedlink.appendChild(docNode.createTextNode('https://xuchi.name/scs-eddies-today/'));
channel.appendChild(feedlink);
feeddesc = docNode.createElement('description');
feeddesc.appendChild(docNode.createTextNode('Detected South China Sea Mesoscale Eddies Updated Everyday'));
channel.appendChild(feeddesc);
feedgenerator = docNode.createElement('generator');
feedgenerator.appendChild(docNode.createTextNode('MATLAB R2015a'));
channel.appendChild(feedgenerator);
language = docNode.createElement('language');
language.appendChild(docNode.createTextNode('en'));
channel.appendChild(language);
copyright = docNode.createElement('copyright');
copyright.appendChild(docNode.createTextNode(['xuchi.name 2019-',datestr(now,'yyyy')]));
channel.appendChild(copyright);
docs = docNode.createElement('docs');
docs.appendChild(docNode.createTextNode('https://validator.w3.org/feed/docs/rss2.html'));
channel.appendChild(docs);
lastBuildDate = docNode.createElement('lastBuildDate');
lastBuildtime=datetime(datestr(now+0.002-8/24,'yyyy-mm-dd HH:MM:SS'));
lastBuildtime.TimeZone='GMT';
lastBuildDate.appendChild(docNode.createTextNode([datestr(lastBuildtime,'ddd, dd mmm yyyy HH:MM:SS'),' GMT']));
channel.appendChild(lastBuildDate);
item = docNode.createElement('item');
itemtitle=docNode.createElement('title');
itemtitle.appendChild(docNode.createTextNode(['NRT L4 SSTA (color) superposed with NRT L4 SSHA (black contours) and Detected Eddy Edges - ',file_date]));
item.appendChild(itemtitle);
itemlink=docNode.createElement('link');
itemlink.appendChild(docNode.createTextNode(['http://data.scsio.ac.cn/api/web/v1/characteristic/image/','SSTA_SSHA_',num2str(day(i,1)),'-',num2str(day(i,2)),'-',num2str(day(i,3)),'-L4nrt-allsat.png']));
item.appendChild(itemlink);
itemdesc=docNode.createElement('description');
itemdesc.appendChild(docNode.createTextNode('<img src="https://gitee.com/oceanography/South-China-Sea-Mesoscale-Eddies-Today/raw/master/SSTA_SSHA_latest-L4nrt.png"></img><br>Positive SSHA indicated by black solid line while negative SSHA denoted by black dashed line. The interval of SSHA is 2 cm. Closed magenta contours stand for the edges of detected anticyclonic eddies while closed green ones mark the eddges of cyclonic eddies. The color shading shows the SSTA with intervals of 0.1 centidegree. The SSTA results from the SST value on each grid point minus the spatial mean of this SST snapshot. Thin gray curves stand for isobars of 500m, 1000m, 2000m and 3000m deep.'));
item.appendChild(itemdesc);
itempubdate=docNode.createElement('pubDate');
itemtime=datetime(datestr(now-8/24,'yyyy-mm-dd HH:MM:SS'));
itemtime.TimeZone='GMT';
itempubdate.appendChild(docNode.createTextNode([datestr(itemtime,'ddd, dd mmm yyyy HH:MM:SS'),' GMT']));
item.appendChild(itempubdate);
itemguid=docNode.createElement('guid');
itemguid.appendChild(docNode.createTextNode(['http://data.scsio.ac.cn/api/web/v1/characteristic/image/','SSTA_SSHA_',num2str(day(i,1)),'-',num2str(day(i,2)),'-',num2str(day(i,3)),'-L4nrt-allsat.png']));
item.appendChild(itemguid);
channel.appendChild(item);
item = docNode.createElement('item');
itemtitle=docNode.createElement('title');
itemtitle.appendChild(docNode.createTextNode(['NRT L4 SST gradient magnitude (color) superposed with NRT L4 SSHA (black contours) and Detected Eddy Edges - ',file_date]));
item.appendChild(itemtitle);
itemlink=docNode.createElement('link');
itemlink.appendChild(docNode.createTextNode(['http://data.scsio.ac.cn/api/web/v1/characteristic/image/','SSTgm_SSHA_',num2str(day(i,1)),'-',num2str(day(i,2)),'-',num2str(day(i,3)),'-L4nrt-allsat.png']));
item.appendChild(itemlink);
itemdesc=docNode.createElement('description');
itemdesc.appendChild(docNode.createTextNode('<img src="https://gitee.com/oceanography/South-China-Sea-Mesoscale-Eddies-Today/raw/master/SSTgm_SSHA_latest-L4nrt.png"></img><br>Positive SSHA indicated by black solid line while negative SSHA denoted by black dashed line. The interval of SSHA is 2 cm. Closed magenta contours stand for the edges of detected anticyclonic eddies while closed green ones mark the eddges of cyclonic eddies. Thin gray curves stand for isobars of 500m, 1000m, 2000m and 3000m deep. The color shading stands for the pattern of SST gradient magnitudes.'));
item.appendChild(itemdesc);
itempubdate=docNode.createElement('pubDate');
itemtime=datetime(datestr(now-8/24,'yyyy-mm-dd HH:MM:SS'));
itemtime.TimeZone='GMT';
itempubdate.appendChild(docNode.createTextNode([datestr(itemtime,'ddd, dd mmm yyyy HH:MM:SS'),' GMT']));
item.appendChild(itempubdate);
itemguid=docNode.createElement('guid');
itemguid.appendChild(docNode.createTextNode(['http://data.scsio.ac.cn/api/web/v1/characteristic/image/','SSTgm_SSHA_',num2str(day(i,1)),'-',num2str(day(i,2)),'-',num2str(day(i,3)),'-L4nrt-allsat.png']));
item.appendChild(itemguid);
channel.appendChild(item);
rss.appendChild(channel);
xmlwrite('rss.xml',docNode);需要注意的就是,似乎有些版本的MATLAB在上面若干步骤生成datetime类变量时会报错。
XML格式RSS文件所需元素是参考的RSS官方说明。这个脚本只写了一些必须的元素,官方说明里有很多可选元素可以发挥,比如在文件里加入关于作者或网站管理员的信息,等等。
这个脚本放到“今日南海中尺度涡”的自动运行程序里跑出来的RSS文件可以在这里看到和订阅。贴一个TG里用bot订阅的效果图: